For people who work in search engine marketing, monthly reporting can be either a grim or a glorious time of each month. Not only are you taking your own hard look at how your campaign efforts are performing but you also have to relay them to clients. Do you feel like both might be lost in translation? Don’t worry, we’ve all been there. As search engine marketers, we deal in data all day, but how do you explain your results, insights and improvements to someone who may not understand what you’re exactly what you’re talking about? Well, here are a few parts of Google Analytics that you can share with everyone on which can be made a little more universal to everyone with just a few brief explanations.
Audience Overview-
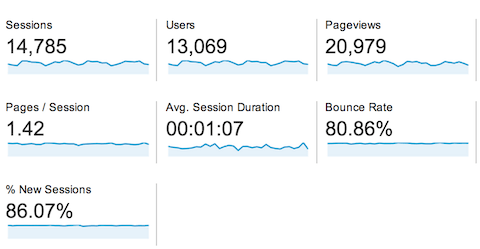
This is the most visible easy and topline portion of Google Analytics and will be the easiest to direct a conversation from because its metrics are the most straightforward.
- Sessions- How many times your site was visited
- Users- Visitors who have visited for the first time, and multiple times
- Avg. Session Duration – How much time was spent on your site on average per visit
- Bounce Rate- How many people get onto your site’s homepage and then immediately leave without checking out more of the site
- %New Sessions- How many first time visitors came to your site
Mobile-
Here is a portion where you can see how your site is being accessed, whether it is by mobile phone, tablet, or desktop computer. It also has the same information as the audience overview, but focuses only on a particular segment. A metric like this depending on what the turnout is, can tell you more about your audience and can push for key changes for your site like making sure it has responsive design to accommodate your userbase.
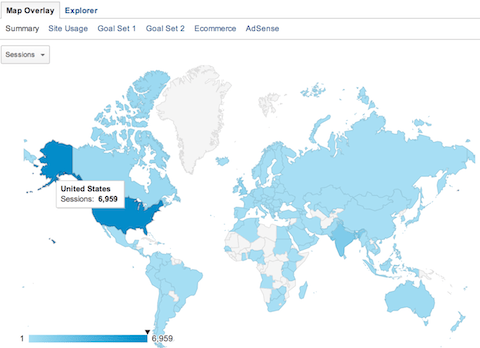
Geo- Language-
Not only can you see how many speakers of a particular language are accessing your site here, but you also get to see geographic distribution as well. This feature allows you to pinpoint certain communities and can drive optimization strategies all toward a certain demographic or help to distribute it on a much greater level. (Admittedly, this is one of my favorite parts of Google Analytics)
Conversions-
Conversions can mean a lot of things for different kinds of websites, but while page views and time spent on site are important for some businesses, what a user consumes while on a site is even more important.
- Goals- depending on your business, goals can be any number of things. Some of the most popular are:
- How many contact forms were filled out?
- How many people called a certain phone number from this site?
- How many appointments were booked using this site?
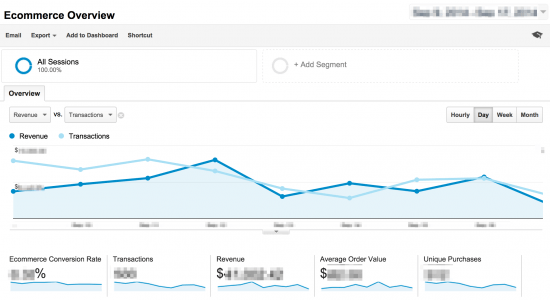
E-commerce-
If your site is retail, then this is an essential part of reporting. This not only tells you how much money you made on your site but, how easy/difficult some items are to find through search. This is a straightforward goal and will help others to see where search efforts are more needed.
While we work with these tools and metrics on a daily basis, it’s important to remember that not everyone speaks SEO. Like learning any other language it’s important to remember others may not get the nuances and loopholes of what we’re saying. Breaking down what we see in simple terms to others is essential in getting the most out of Google Analytics data and your optimization efforts.


