Consumers are looking online first more than ever to make their purchasing decisions—understanding how they interact online is key for your marketing plans going into the new year.
The digital age we live in continues to shift and change at what feels like an exponentially accelerating pace. This doesn’t mean that businesses should expect to fly blind when crafting their marketing strategies — it means that collecting and curating information to give you insights into customer behavior is all the more important.
Understanding consumer and customer trends should remain central to all strategic marketing plans, and recent studies capture a few data points that illuminate two key areas of purchasing behaviors: how people shop, and where they choose to buy.
Just 20% of 2022 holiday shoppers made impulse buys compared to 80% that researched their options ahead of time.
From sporting goods to home appliances, the holiday season remains a staggeringly profitable time for many types of sellers. The latest holiday shopping report from Adobe estimates $210.1 billion in holiday sales for 2022, with more than $20 billion brought in on Black Friday and Cyber Monday alone.

This marks yet another year of steady revenue growth in holiday sales, up from $205 billion in 2021 and $188 billion in 2020. At the same time, growth on these revenue figures continues to drop—an unsurprising trend given the incredible growth rates from years prior.
1. Brick-And-Mortar Shopping Is Back on the Rise With a Digital Twist
Shoppers are looking in-person at nearly the same rates as they did pre-COVID lockdown, but their habits have significantly changed since early 2020. According to data collected by Google and Ipsos, shoppers are turning to digital channels to learn more about their purchasing options to find the best deals and products.
Identify the current condition of your local search presence, and then make a plan.
In 2021, 72% of those surveyed reported searching on a smartphone before heading to a store, 51% watched videos, and 32% used online maps to inform their decisions. All of these figures are significantly higher than they were in early 2020, and the trend isn’t limited to in-person shoppers—even digital buyers are taking more time to research their options. Google and Ipsos surveyed holiday shoppers in November of 2022, and 80% of respondents said they researched or browsed options ahead of making a purchase compared to just 20% who bought on impulse.
Your marketing strategies should take this audience behavior into account. Rather than solely positioning your ads to push for an immediate sale on a specific product, they should also work to paint your brand in a positive light. Take into account what shoppers are looking for and speak to them in a way that keeps what you’re selling top of mind.
2. What do Shoppers Consider When Making a Purchase?
In the Google/Ipsos study, researchers asked shoppers where they looked when deciding where to make a purchase. The top three resources listed were online ratings, reviews, and price comparisons, all ahead of any advice from friends or family. It’s increasingly clear that cultivating a strong online presence is important for businesses, regardless of whether it’s a primarily in-person or online storefront.
Analyze and improve your site’s perceived expertise to achieve optimal SEO performance.
For brick-and-mortar businesses, showing up online is key to the research portion of a customer’s journey, and online-only stores need to cultivate positive feedback to make an impact for browsers to capture their attention. However, there’s another step beyond simply curating an online presence. Understanding how these shoppers interact with online storefronts is key to creating a successful campaign.
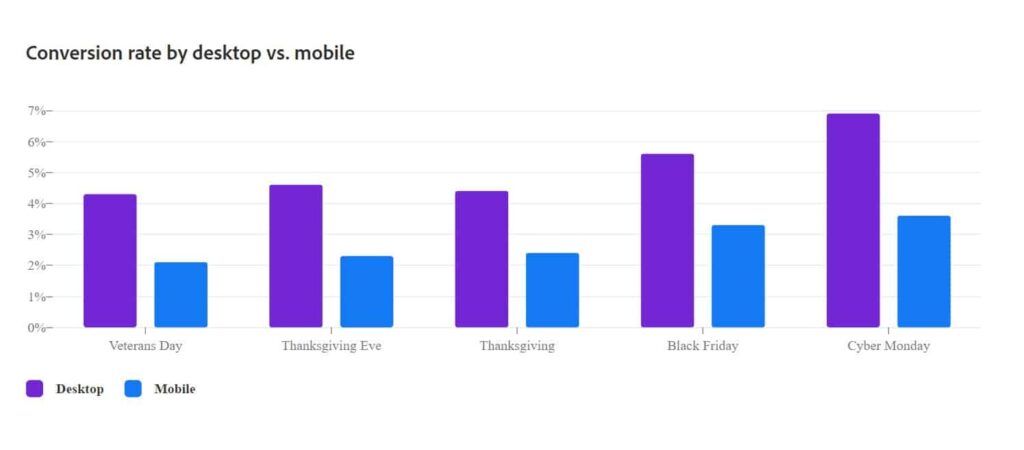
3. Desktop Sale Conversion Nearly Doubles Mobile Conversion Rates

Advertisers’ growing focus on mobile advertising—an expected and understandable pursuit given the meteoric rise of smartphones—can’t come at the expense of advertising targeted to users on a desktop or laptop. This discrepancy has remained nearly the same for years, with theories ranging from difficulties with checking out on mobile apps to screen size to people’s preference for browsing on a phone and completing the purchase later.
User experience (UX) research helps your business not guess or assume, but know exactly what your customers want. Knowledge about your customers’ expectations enables your business to build, scale, and evolve your site to better meet their needs—in turn improving your own success.
One of the most consistently cited reasons people tend to complete more purchases on a desktop is the ease of checkout. Whether that means adding extra steps to create an account that takes the user away from the shopping cart page, a poorly optimized version of the shopping cart for mobile users, poor autofill settings, and more, optimizing your mobile shopping experience is vital to turning potential buyers into confirmed sales.
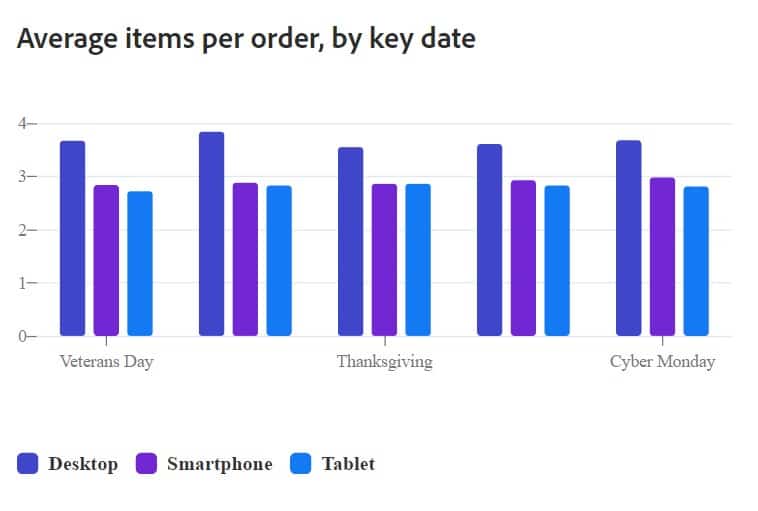
4. Shoppers Are Buying More on Desktop

Not only do desktop users convert more consistently than mobile users, but they’re also buying more per order as well. Despite the fact that web visits are split nearly 50/50 for mobile vs desktop users, both the higher conversion rates and larger purchase sizes are eye-catching statistics.
Some of this could be due to attribution error. According to other studies, there is likely a subset of people who spend the first part of their purchasing journey browsing on their mobile device and adding products to their cart as they go before transitioning to a desktop to complete the purchase.
This again could be tied to the checkout issues mentioned above, but can also be influenced by user preference. Someone browsing a shopping site in public who doesn’t already have their payment information easily accessible by autofill preferences isn’t terribly likely to pull out a credit card on a crowded train, store, or any other location a security-conscious person may be using their phone.
Understanding your Core Web Vital score, a key website metric, helps you build a better user experience. Using audience insights to build an idea of how they interact with your website will help boost conversions and ensure your offerings are surfaced where they need to be.
When considered in conjunction with the information gleaned from the slate of Google and Ipsos studies, these online vs. desktop trends indicate that mobile shoppers spend time on digital storefronts to research their options before moving to their preferred purchasing location, whether that’s on their desktop computer or physically in a store.
Understanding how shoppers interact with online shopping options is only one part of a data-centric, performance-driven strategy, giving you the power to know more and do more. Dig deeper into Google’s latest updates to Performance Max, the newest iteration of Google Ads’ campaign service, or let’s talk about how to achieve more for your marketing—and your business.
Additional author: Ryan Smythe, Content Manager


